


C++ || Empirical Analysis Using Min Element, Bubble Sort, & Selection Sort

The following is another homework assignment which was presented in an Algorithm Engineering class. Using a custom timer class, the following is a program which performs an empirical analysis of three non recursive algorithms. This program implements the algorithms and displays their performance running time to the screen.
The algorithms being examined are: MinElement, which finds the smallest element an array. Bubble Sort, and Selection Sort.
==== 1. ASYMPTOTIC ANALYSIS ====
Selection sort and Bubble sort both run in O(n2) time. MinElement runs in O(n) time. The empirical analysis implemented in this program should agree with the above asymptotic bounds, but sometimes experiments surprise us.
==== 2. EMPIRICAL ANALYSIS ====
To analyze the three algorithms empirically the elapsed running time (in seconds) should be measured for various values of array sizes “n.” These results should be graphed on a scatter plot, which will then help to infer which complexity class the plot corresponds to. The asymptotic analysis above says that we should expect these graphs to resemble linear or quadratic curves.
Timing code for empirical analysis takes some care. It is important to measure the elapsed time of only the code for the algorithm itself, and not other steps such as loading input files or printing output. Also, since computer code executes very rapidly, it is important to measure time in small fractions of seconds.
==== 3. WHAT TO MEASURE ====
The goal is to draw a scatter plot graph for each algorithm’s running times (a total of three plots). Each plot needs to have enough data points to interpolate a fitting curve; 5 is the smallest number that might be reasonable.
So each algorithm should be ran for at least 5 different values of size “n.” At least one very small value of n (less than 10) should be included, and one big value that’s large enough to make the code run for at least 5 minutes should be used. Once the data is graphed, the curve should resemble the appropriate asymptotic bounds for the function being examined.
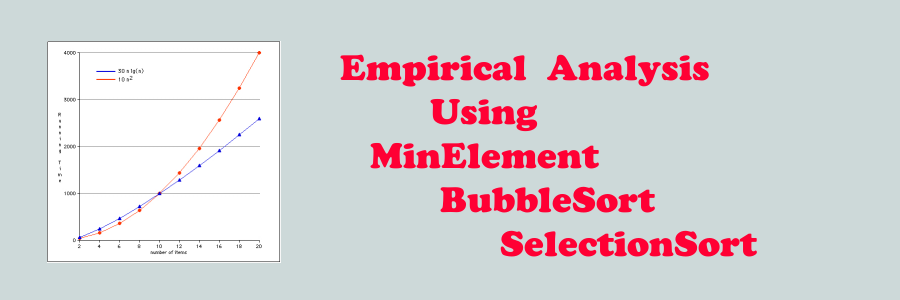
Note: This page will present sample code for the above problem, but scatter plots will not be provided.
==== 4. FLOW OF CONTROL ====
A test harness program is created which executes the above functions and measures the elapsed time of the code corresponding to the algorithm in question. The test program will perform the following steps:
1. Input the value of n. Your code should treat n as a variable.

2. Create an array or vector of n random integers to serve as a problem instance.

3. Use a clock function to get the current time t1 .

4. Execute one algorithm (MinElement, bubble sort, or insertion sort), using the array of random integers as input.

5. Use a clock function to get the current time t2 .

6. Output the elapsed time, t2 − t1 .
The test harness is configured in such a way to run all of the three algorithms, using a switch statement to change between the algorithms.
==== 5. TEST HARNESS ====
Note: This program uses a custom Timer class (Timer.h). To obtain code for that class, click here.
“Project1.h” is listed below.
|
1 2 3 4 5 6 7 8 9 10 11 12 13 14 15 16 17 18 19 20 21 22 23 24 25 26 27 28 29 30 31 32 33 34 35 36 37 38 39 40 41 42 43 44 45 46 47 48 49 50 51 52 53 54 55 56 57 58 59 60 61 62 63 64 65 66 67 68 69 70 71 72 73 74 75 76 77 78 79 80 81 82 83 84 85 86 87 88 89 90 91 92 93 94 95 96 97 98 99 100 101 102 |
// ============================================================================= // Author: K Perkins // Date: Nov 1, 2013 // Taken From: http://programmingnotes.org/ // File: main.cpp // Description: This is the test harness program which runs the code and // measures the elapsed time of the code corresponding to the algorithm // in question. This test program performs the following operations: // 1. Input a value of n. // 2. Create an array of n random integers to serve as a problem instance // 3. Use a clock function to get the current time t1. // 4. Execute one algorithm (MinElement, bubble sort, insertion sort), // using the array of random integers as input. // 5. Use a clock function to get the current time t2. // 6. Output the elapsed time, t2 - t1. // ============================================================================= #include <iostream> #include <ctime> #include <cstdlib> #include "Timer.h" #include "Project1.h" using namespace std; // typedefs for the functions to use enum Algorithms {minElem, bubble, selection}; // the total number of algs to execute const int NUM_ALGS = 3; // default array size const int ARRAY_SIZE = 20000; int main() { srand(time(NULL)); int* arry = new int[ARRAY_SIZE]; int min = 0; int seed = rand(); // generate a random seed to use for array on all algorithms Timer timer; Project1 proj1; // display the array size cerr<<"nArray Size = "<<ARRAY_SIZE<<endl; // loop to automatically execute the alg being tested for(int x=0; x < NUM_ALGS; ++x) { cout<<"n----- STARTING ALGORITHM #"<<x+1<<" ----- nn"; timer.Reset(); // place data into the array proj1.Generate(arry, ARRAY_SIZE, seed); // display data in array if its within range if(ARRAY_SIZE <= 25) { proj1.Display(arry, ARRAY_SIZE); cout<<endl; } // start the timer timer.Start(); // determine which alg to execute switch(x) { case minElem: min = proj1.MinElement(arry, ARRAY_SIZE); cout<<"nMin = "<<min<<endl; break; case selection: proj1.SelectionSort(arry, ARRAY_SIZE); break; case bubble: proj1.BubbleSort(arry, ARRAY_SIZE); break; default: cout<<"nThat option doesnt exist...n"; exit(1); break; } // stop the timer timer.Stop(); // display data in array if its within range if(ARRAY_SIZE <= 25) { cout<<endl; proj1.Display(arry, ARRAY_SIZE); cout<<endl; } // display total elapsed time cout<<endl<<"It took "<<timer.Elapsed()*1000 <<" clicks ("<<timer.Elapsed()<<" seconds)"<<endl; cout<<"n----- ALGORITHM #"<<x+1<<" DONE! ----- nn"; } return 0; }// http://programmingnotes.org/ |
==== 6. THE ALGORITHMS – “include Project1.h” ====
|
1 2 3 4 5 6 7 8 9 10 11 12 13 14 15 16 17 18 19 20 21 22 23 24 25 26 27 28 29 30 31 32 33 34 35 36 37 38 39 40 41 42 43 44 45 46 47 48 49 50 51 52 53 54 55 56 57 58 59 60 61 62 63 64 65 66 67 68 69 70 71 72 73 74 75 76 77 78 79 80 81 82 83 |
// ============================================================================= // Author: K Perkins // Date: Nov 1, 2013 // Taken From: http://programmingnotes.org/ // File: Project1.h // Description: This is a simple class which holds the functions for // project 1 // ============================================================================= #ifndef PROJECT1_H #define PROJECT1_H #include <iostream> #include <cassert> #include <cstdlib> #include <algorithm> class Project1 { public: Project1(){} int MinElement(int arry[], int size) { assert(size > 0); int min = arry[0]; for(int x=1; x < size; ++x) { if(arry[x] < min) { min = arry[x]; } } return min; }// end of MinElement void SelectionSort(int arry[], int size) { for(int x=0; x <= size-2; ++x) { int min = x; for(int y=x+1; y <= size-1; ++y) { if(arry[y] < arry[min]) { min = y; } } std::swap(arry[x], arry[min]); } }// end of SelectionSort void BubbleSort(int arry[], int size) { for(int x=0; x <= size-2; ++x) { for(int y=0; y <= (size-2)-x; ++y) { if(arry[y+1] < arry[y]) { std::swap(arry[y], arry[y+1]); } } } }// end of BubbleSort void Generate(int arry[], int size, int seed) { srand(seed); for(int x=0; x < size; ++x) { arry[x] = rand() % 7281987; } }// end of Generate void Display(int arry[], int size) { for(int x=0; x < size; ++x) { std::cout<<arry[x]<<" "; } }// end of Display ~Project1(){} }; #endif // http://programmingnotes.org/ |
QUICK NOTES:
The highlighted lines are sections of interest to look out for.
The code is heavily commented, so no further insight is necessary. If you have any questions, feel free to leave a comment below.
Note: This page presents sample code for the above problem, but scatter plots will not be provided.
The following is sample output:
Array Size = 20000----- STARTING ALGORITHM #1 -----
Min = 2
It took 0 clicks (0 seconds)
----- ALGORITHM #1 DONE! -----
----- STARTING ALGORITHM #2 -----
It took 4350 clicks (4.35 seconds)
----- ALGORITHM #2 DONE! -----
----- STARTING ALGORITHM #3 -----
It took 2150 clicks (2.15 seconds)
----- ALGORITHM #3 DONE! -----


Leave a Reply